Randomizes a raster stack with fixed richness. Randomizations are based on frequencies (given or calculated from x) and, optionally, a probability raster stack. Both, frequencies and probability raster stack, control the probability that a given species is sampled in each cell raster. Frequency controls the probability of each species being sampled compared to all others. Probability raster stack controls the probability that each species is sampled in a given raster cell.
Usage
bootspat_str(
  x,
  rprob = NULL,
  rich = NULL,
  fr_prob = NULL,
  cores = 1,
  filename = "",
  memory = NULL,
  overwrite = FALSE,
  ...
)
Arguments
- x
SpatRaster. A presence-absence SpatRaster.
- rprob
SpatRaster. Stack of probability values. Structures the spatial pattern of each randomized species.
- rich
SpatRaster. Richness pattern structuring the sample size of each cell randomization. Calculated if not provided.
- fr_prob
Either frequency of pixels or probability that a species is observed across the whole layer.
- cores
positive integer. If
cores > 1, a 'parallel' package cluster with that many cores is created and used. You can also supply a cluster object. Ignored for functions that are implemented by terra in C++ (see under fun)- filename
character. Output filename
- memory
logical. Checks if there is enough available RAM memory. Calculated if NULL
- overwrite
logical. If
TRUE,filenameis overwritten- ...
additional parameters for terra::app
Examples
# load random species distributions
library(SESraster)
library(terra)
r <- load_ext_data()
plot(r)
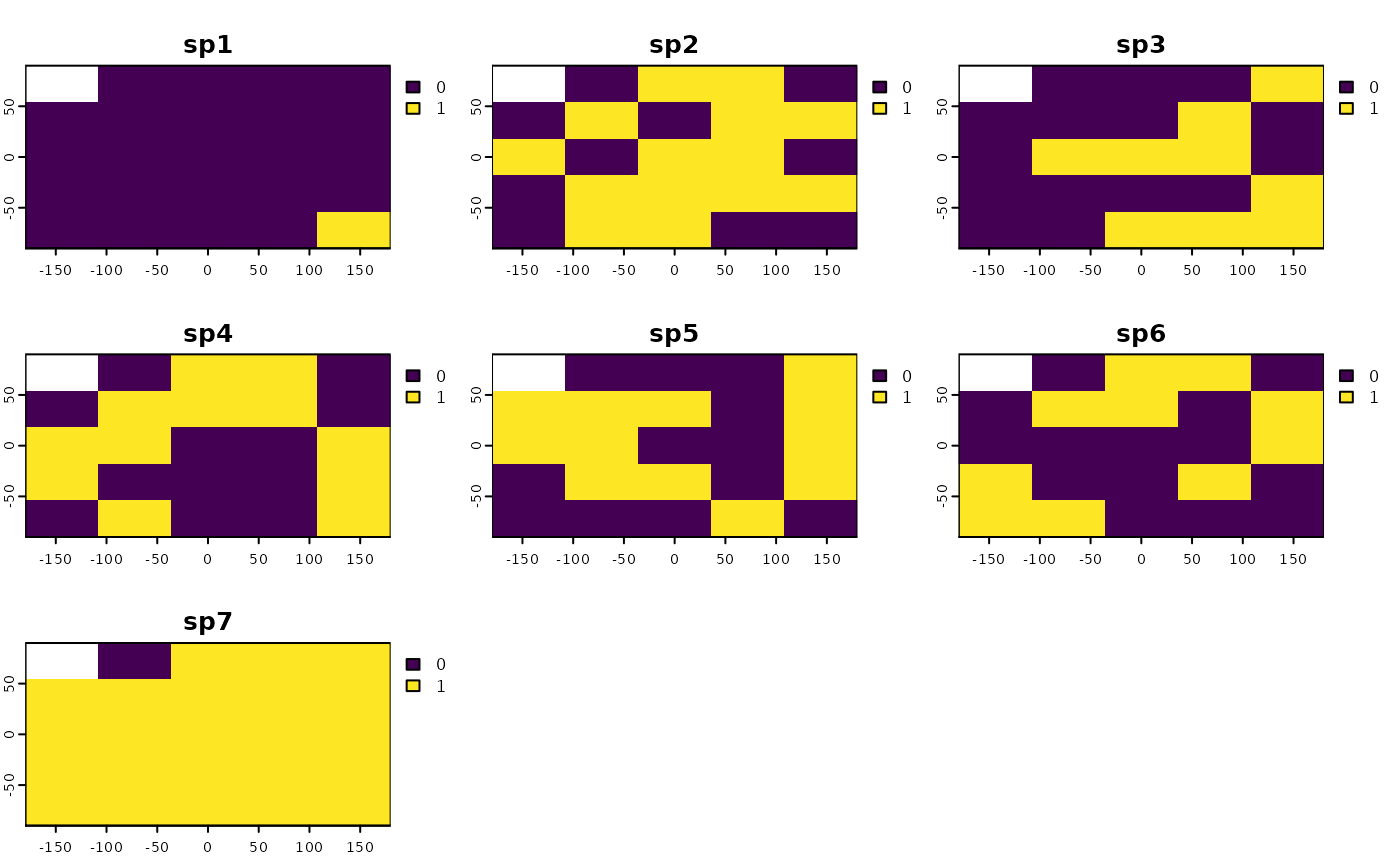 # applying the function
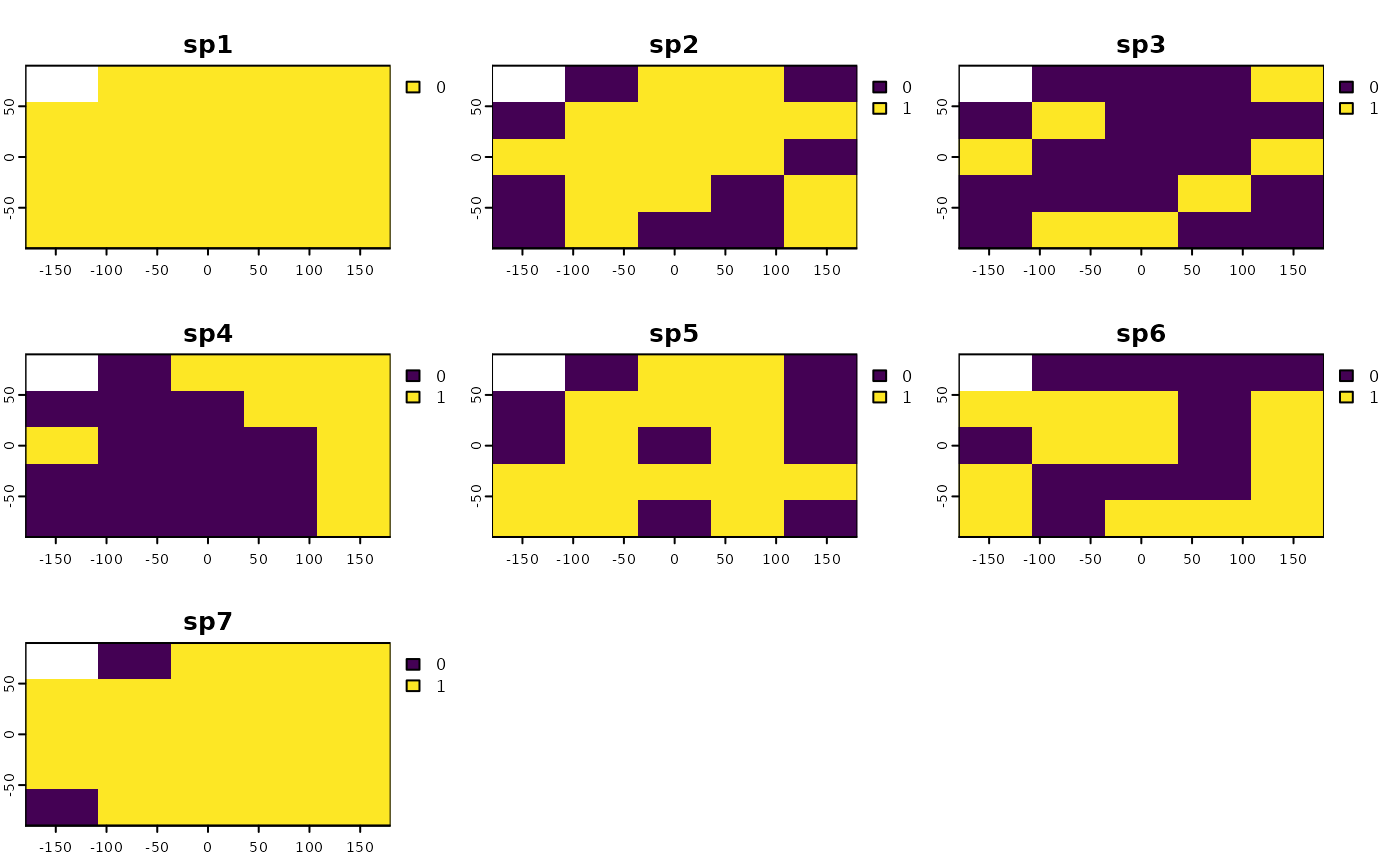
rand.str <- bootspat_str(r)
plot(rand.str)
# applying the function
rand.str <- bootspat_str(r)
plot(rand.str)
 # With null probability raster
rprobnull <- terra::app(r,
function(x){
ifelse(is.na(x), NA, 1)
})
rand.str2 <- bootspat_str(r, rprob = rprobnull)
library(SESraster)
library(terra)
# creating random species distributions
f <- system.file("ex/elev.tif", package="terra")
r <- rast(f)
set.seed(510)
r10 <- rast(lapply(1:18,
function(i, r, mn, mx){
app(r, function(x, t){
sapply(x, function(x, t){
x<max(t) & x>min(t)
}, t=t)
}, t=sample(seq(mn, mx), 2))
}, r=r, mn=minmax(r)[1]+10, mx=minmax(r)[2]-10))
names(r10) <- paste("sp", 1:nlyr(r10))
plot(r10)
# With null probability raster
rprobnull <- terra::app(r,
function(x){
ifelse(is.na(x), NA, 1)
})
rand.str2 <- bootspat_str(r, rprob = rprobnull)
library(SESraster)
library(terra)
# creating random species distributions
f <- system.file("ex/elev.tif", package="terra")
r <- rast(f)
set.seed(510)
r10 <- rast(lapply(1:18,
function(i, r, mn, mx){
app(r, function(x, t){
sapply(x, function(x, t){
x<max(t) & x>min(t)
}, t=t)
}, t=sample(seq(mn, mx), 2))
}, r=r, mn=minmax(r)[1]+10, mx=minmax(r)[2]-10))
names(r10) <- paste("sp", 1:nlyr(r10))
plot(r10)
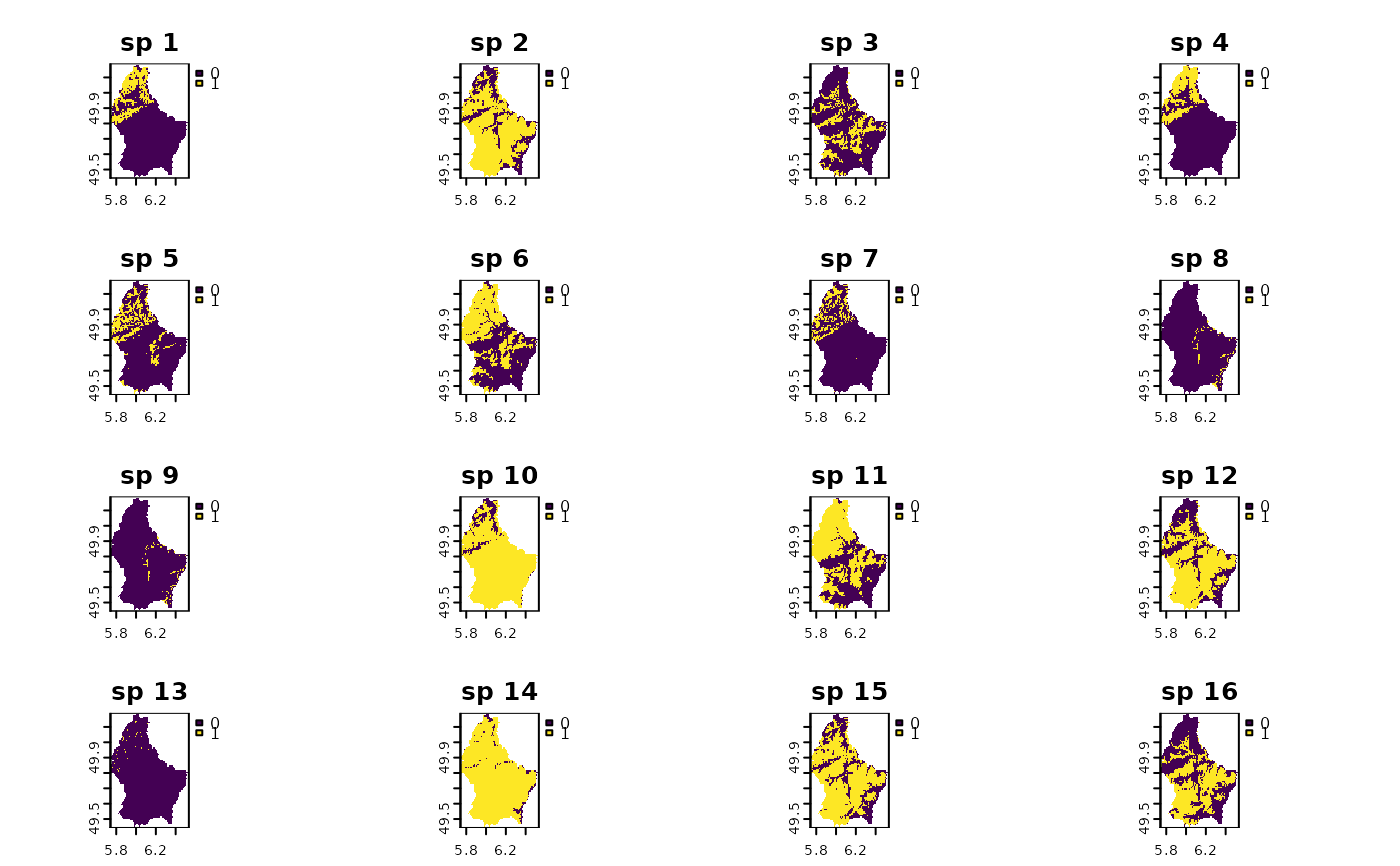 rprobnull <- terra::app(r10,
function(x){
ifelse(is.na(x), NA, 1)
})
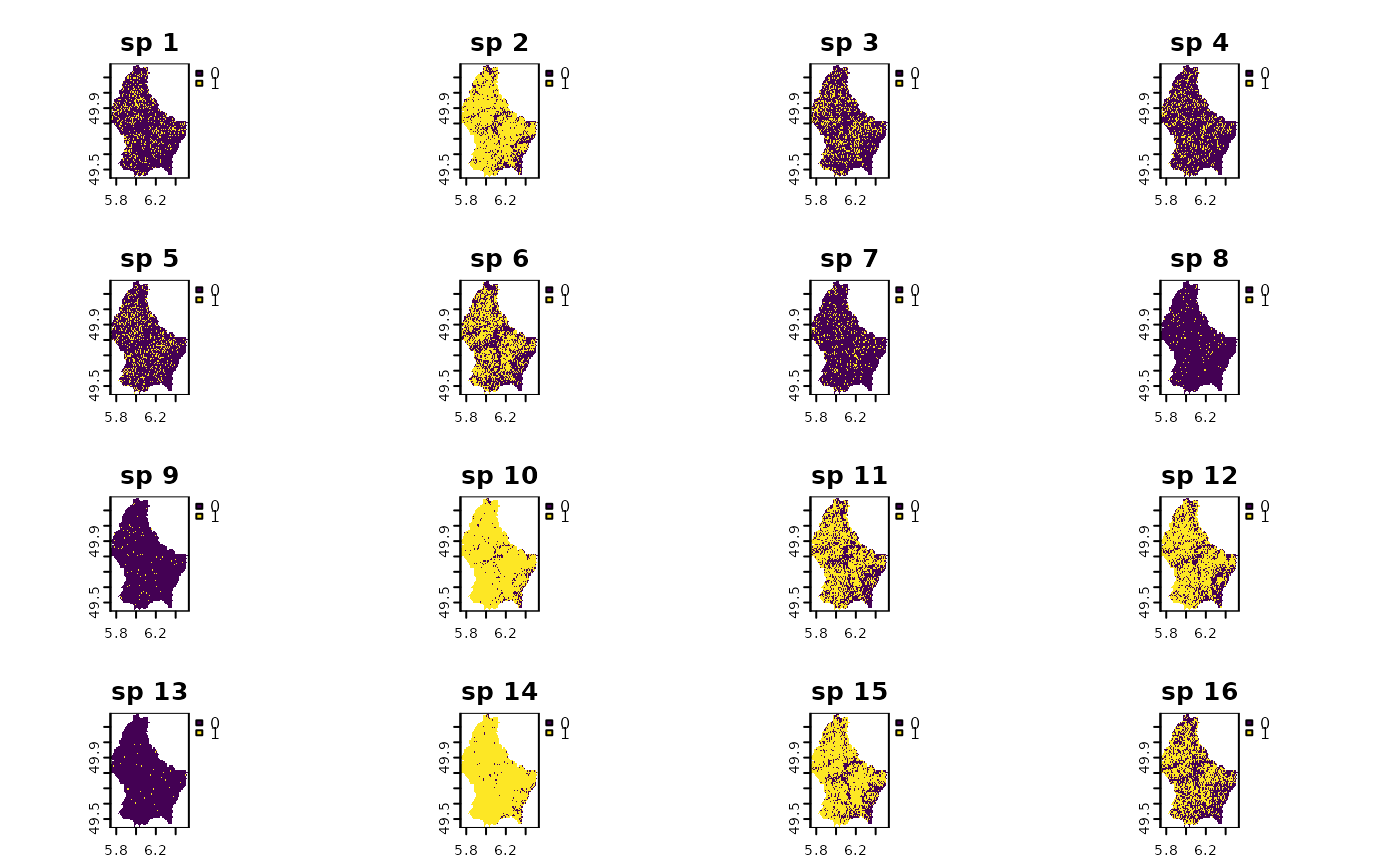
# bootstrapping once
randr10 <- bootspat_str(r10, rprobnull)
plot(randr10)
rprobnull <- terra::app(r10,
function(x){
ifelse(is.na(x), NA, 1)
})
# bootstrapping once
randr10 <- bootspat_str(r10, rprobnull)
plot(randr10)
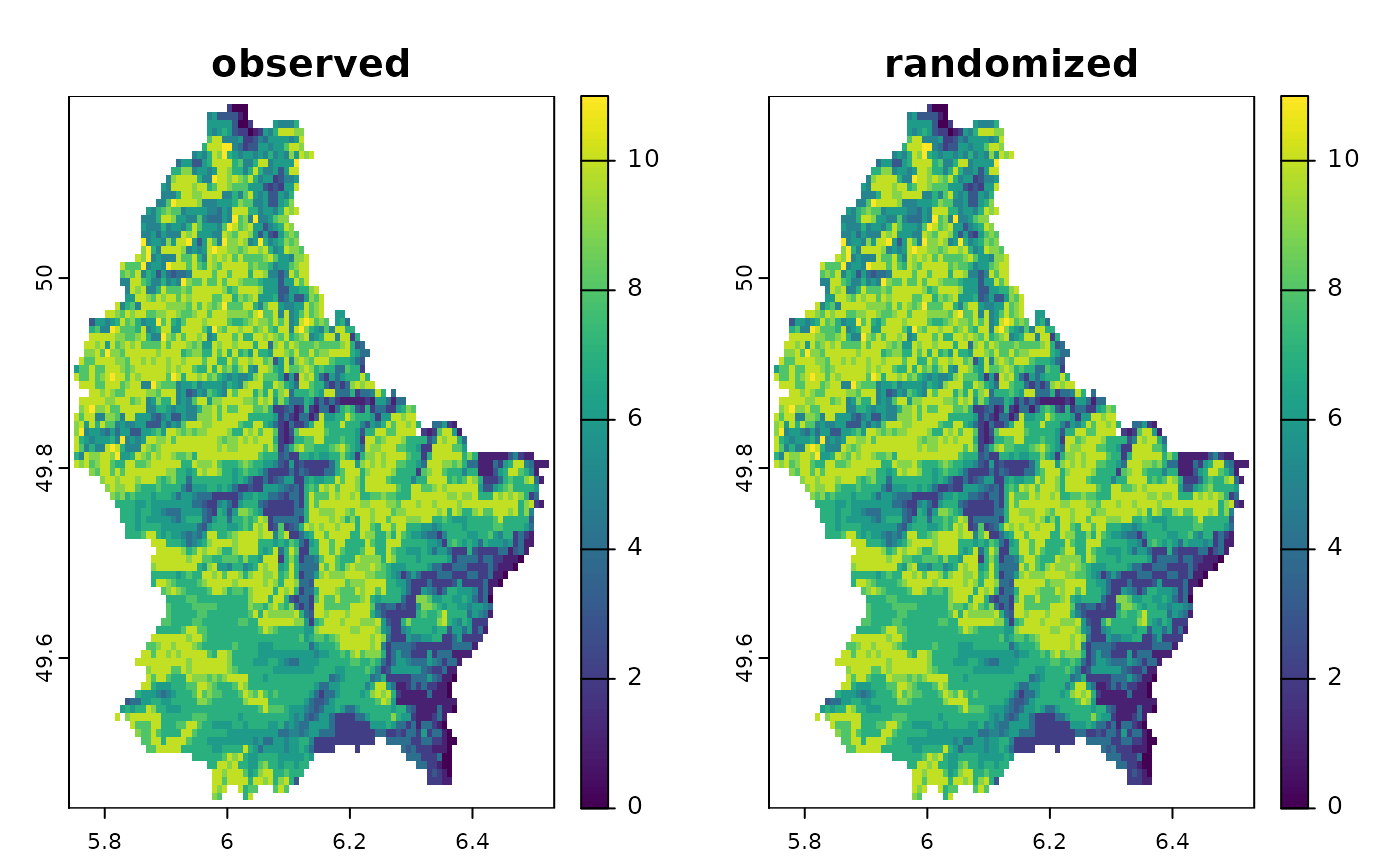
 plot(c(sum(r10), sum(randr10)), main=c("observed", "randomized"))
 cbind(observed=sapply(r10, function(x)freq(x)[2,3]),
randomized=sapply(randr10, function(x)freq(x)[2,3]))
#> observed randomized
#> [1,] 767 672
#> [2,] 3443 3564
#> [3,] 1175 1071
#> [4,] 889 787
#> [5,] 908 816
#> [6,] 2160 2189
#> [7,] 548 442
#> [8,] 133 125
#> [9,] 122 91
#> [10,] 4174 4231
#> [11,] 2565 2606
#> [12,] 3031 3117
#> [13,] 36 33
#> [14,] 4387 4418
#> [15,] 3270 3394
#> [16,] 2198 2235
#> [17,] 2427 2474
#> [18,] 235 203
cbind(observed=sapply(r10, function(x)freq(x)[2,3]),
randomized=sapply(randr10, function(x)freq(x)[2,3]))
#> observed randomized
#> [1,] 767 672
#> [2,] 3443 3564
#> [3,] 1175 1071
#> [4,] 889 787
#> [5,] 908 816
#> [6,] 2160 2189
#> [7,] 548 442
#> [8,] 133 125
#> [9,] 122 91
#> [10,] 4174 4231
#> [11,] 2565 2606
#> [12,] 3031 3117
#> [13,] 36 33
#> [14,] 4387 4418
#> [15,] 3270 3394
#> [16,] 2198 2235
#> [17,] 2427 2474
#> [18,] 235 203